Afrah Nazar / Research / Fruit-fly connectome
4th Place (Biotechnology) · ACSEF · March 2025Intelligence Mapping via Neuroplasticity in the Fruit-Fly Connectome
What does a small fruit-fly brain teach us about big ones?
- 186,000neurons in the fly brain
- 120neurons in my simulation
- 5cell types modelled
- 2 × 2odour cases: attract or repel, weak or strong
The question
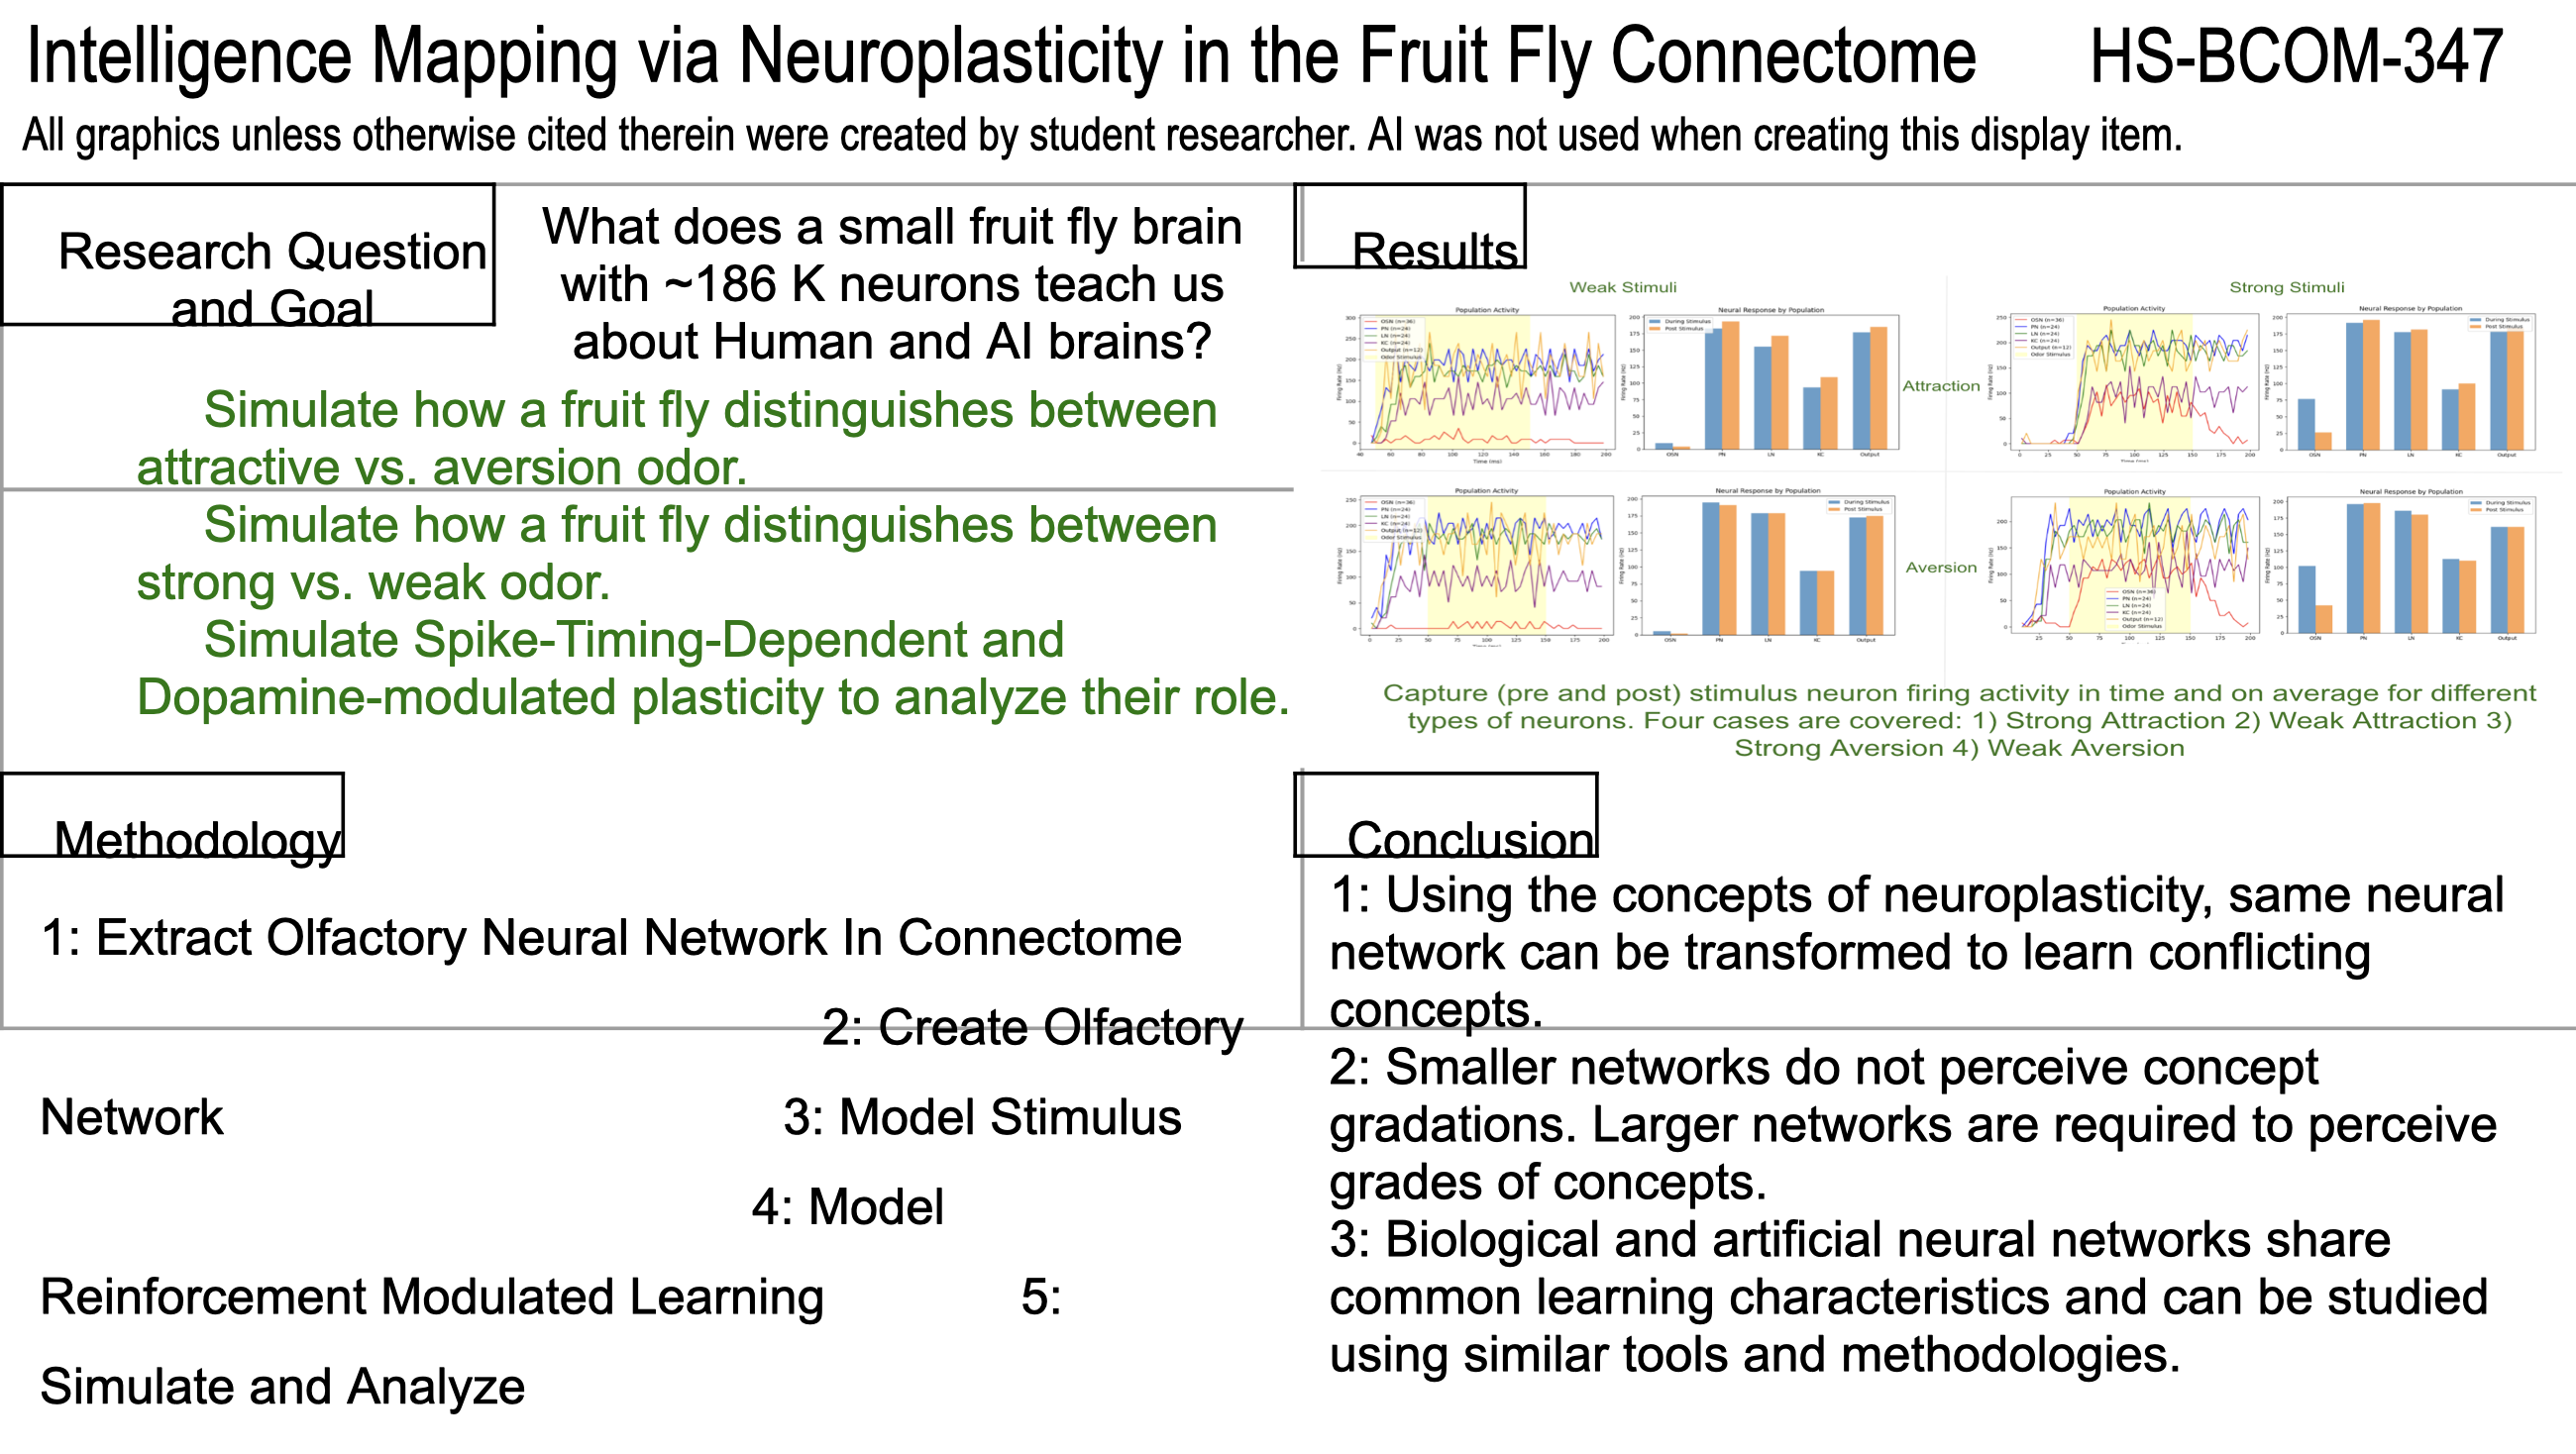
A human brain has 86 billion neurons; a large language model has 500 billion parameters. Both are far too big to trace. A fruit fly has 186,000 neurons, and its wiring has been mapped in full. So: what does a small brain teach us about big ones? Concretely, three things to simulate — how the fly tells an attractive odor from an aversive one, how it tells a strong odor from a weak one, and what spike-timing-dependent and dopamine-modulated plasticity each contribute.
Building the circuit
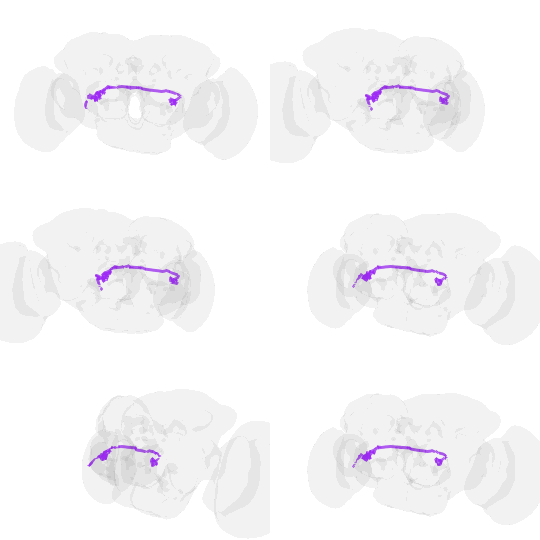
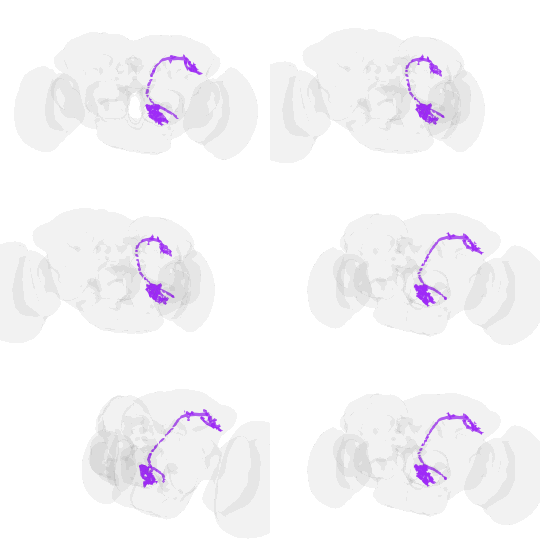
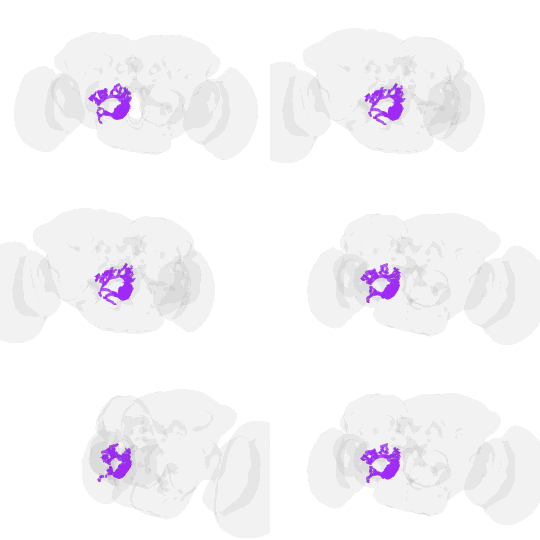
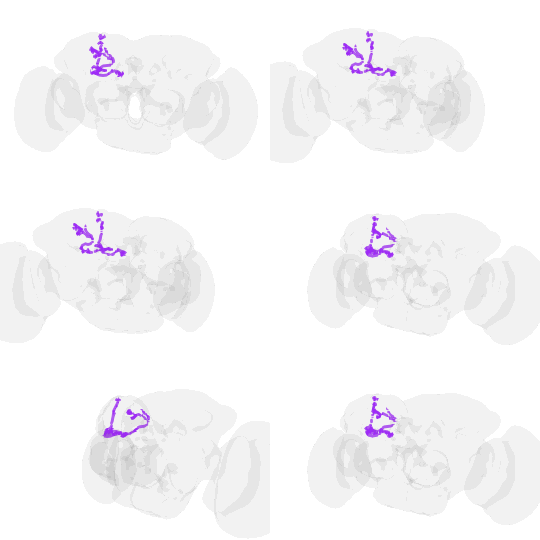
Five steps. Extract the olfactory network from the FlyWire connectome with NetworkX — which neuron types, how many, and how they connect. Rebuild it in Brian2 as 120 simulated neurons, leaky integrate-and-fire cells joined by plastic synapses. Model the odour stimulus. Add reinforcement-modulated learning. Simulate, and read the raster plots and weight curves.
The simulation is deliberately small — small enough to trace every connection, which is the whole reason to start with a fly. Its five cell types and their wiring come from the real map. These are the counts I read off it, and the proportions the model keeps:
| Cell type | In the connectome | Share | Role |
|---|---|---|---|
| Olfactory sensory neurons (OSN) | ~1,400 | 32% | Detect odor in the antennae |
| Projection neurons (PN) | ~400 | 9% | Relay from the antennal lobe to the mushroom body |
| Local interneurons (LN) | ~200 | 4.5% | Local processing within the antennal lobe |
| Kenyon cells (KC) | ~2,200 | 50% | High-dimensional odor representations |
| Output neurons (ON) | ~200 | 4.5% | Project toward the motor circuits |
And the connection densities between them, again read off the map rather than assumed:
| Pathway | Connections in the map | Density used |
|---|---|---|
| OSN → PN | 165,000 | 30% |
| OSN → LN | 138,000 | 50% |
| LN → PN | 34,000 | 40% |
| LN → KC | 43,000 | 10% |
| KC → ON | 130,000 | 30% |
Results
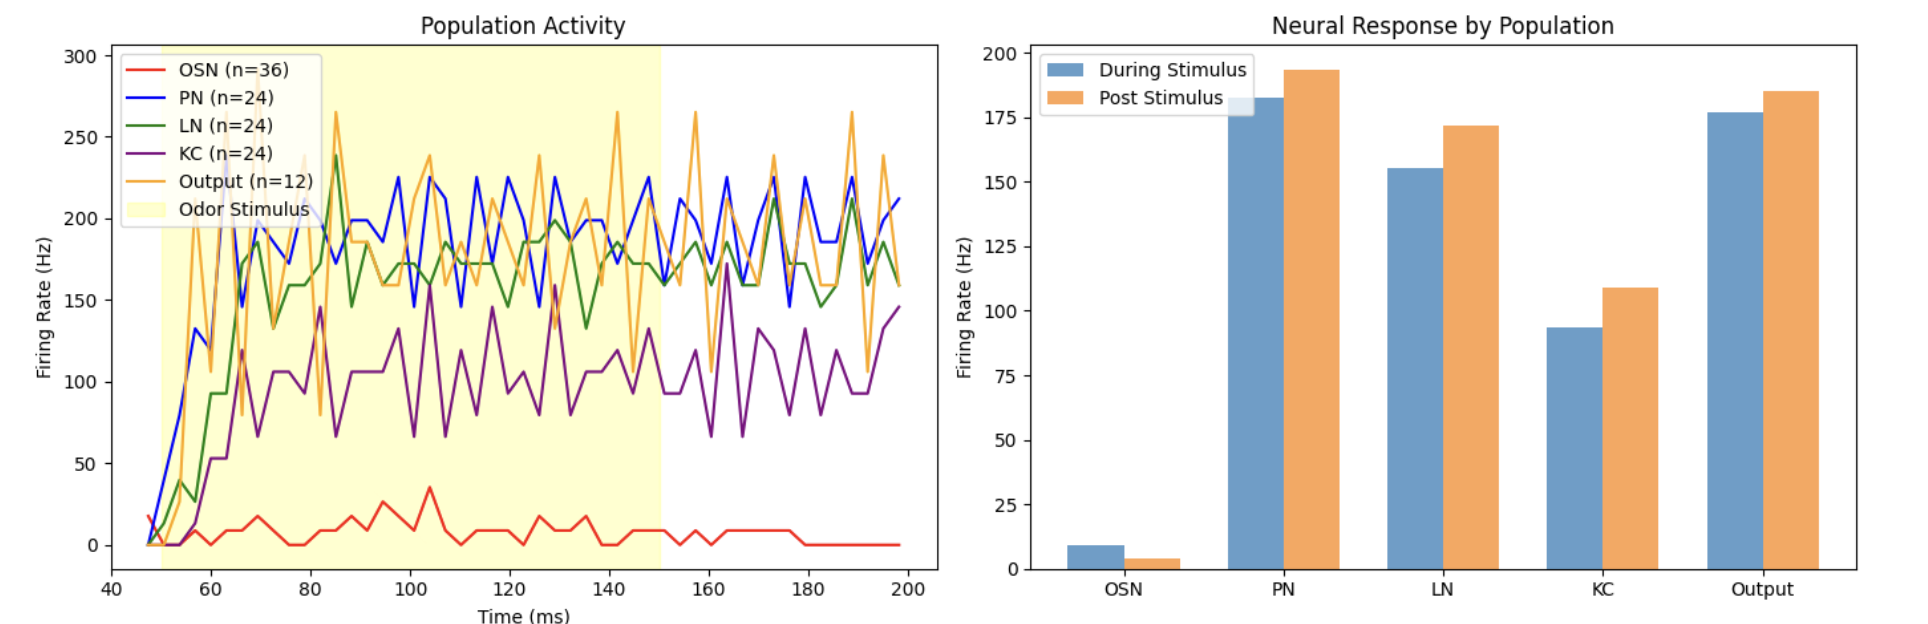
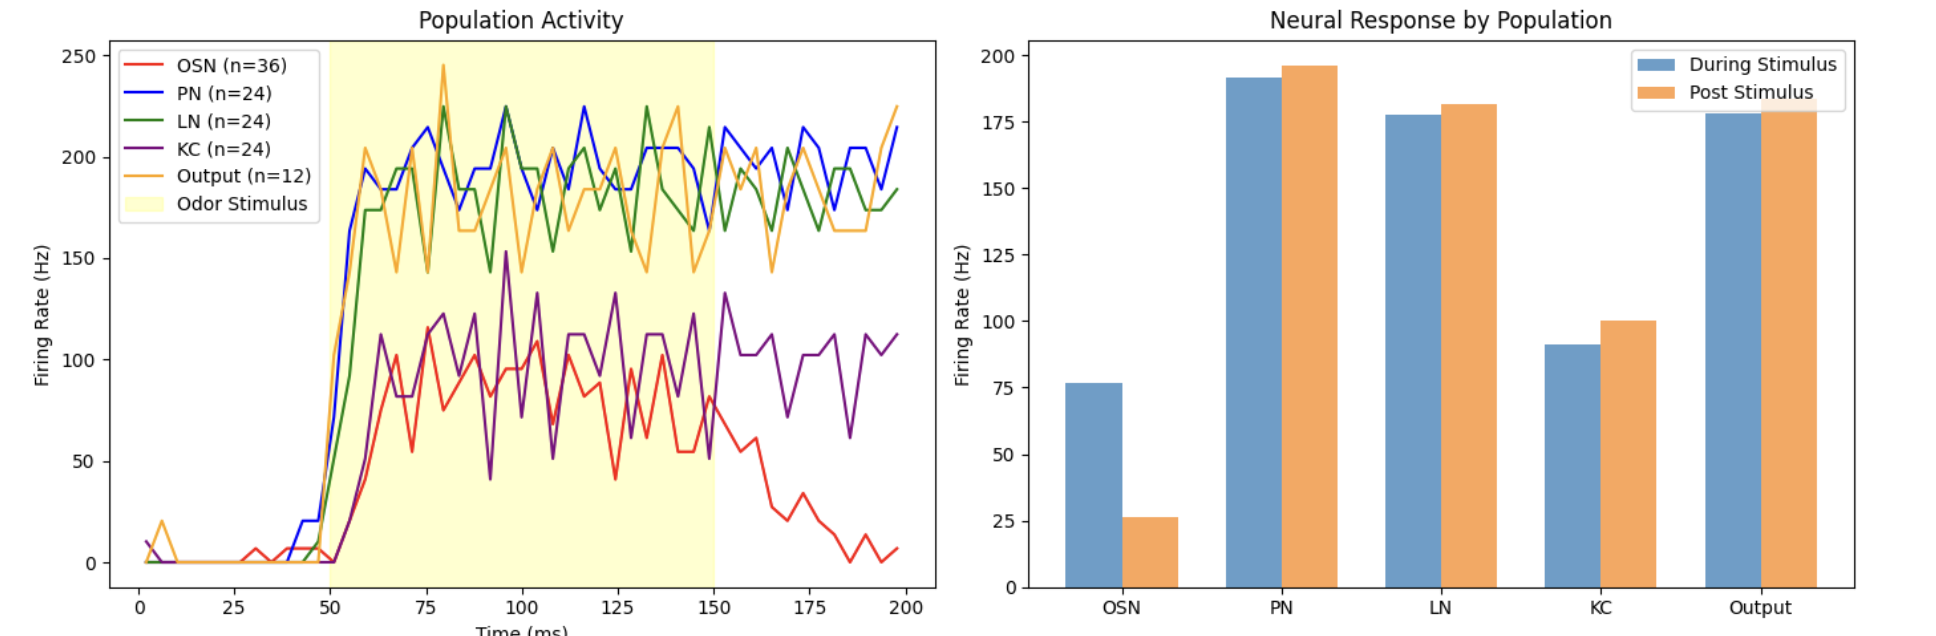
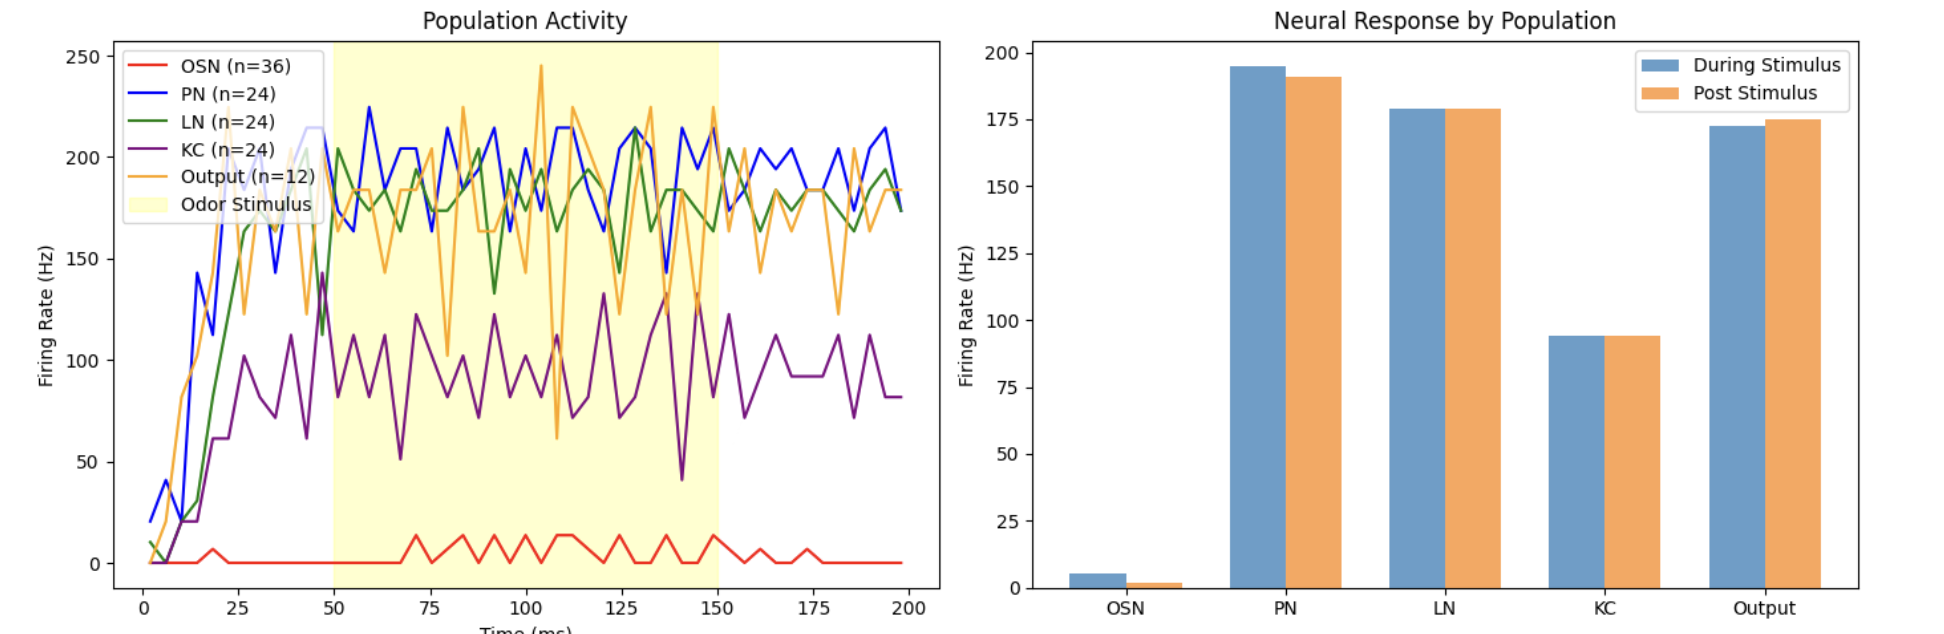
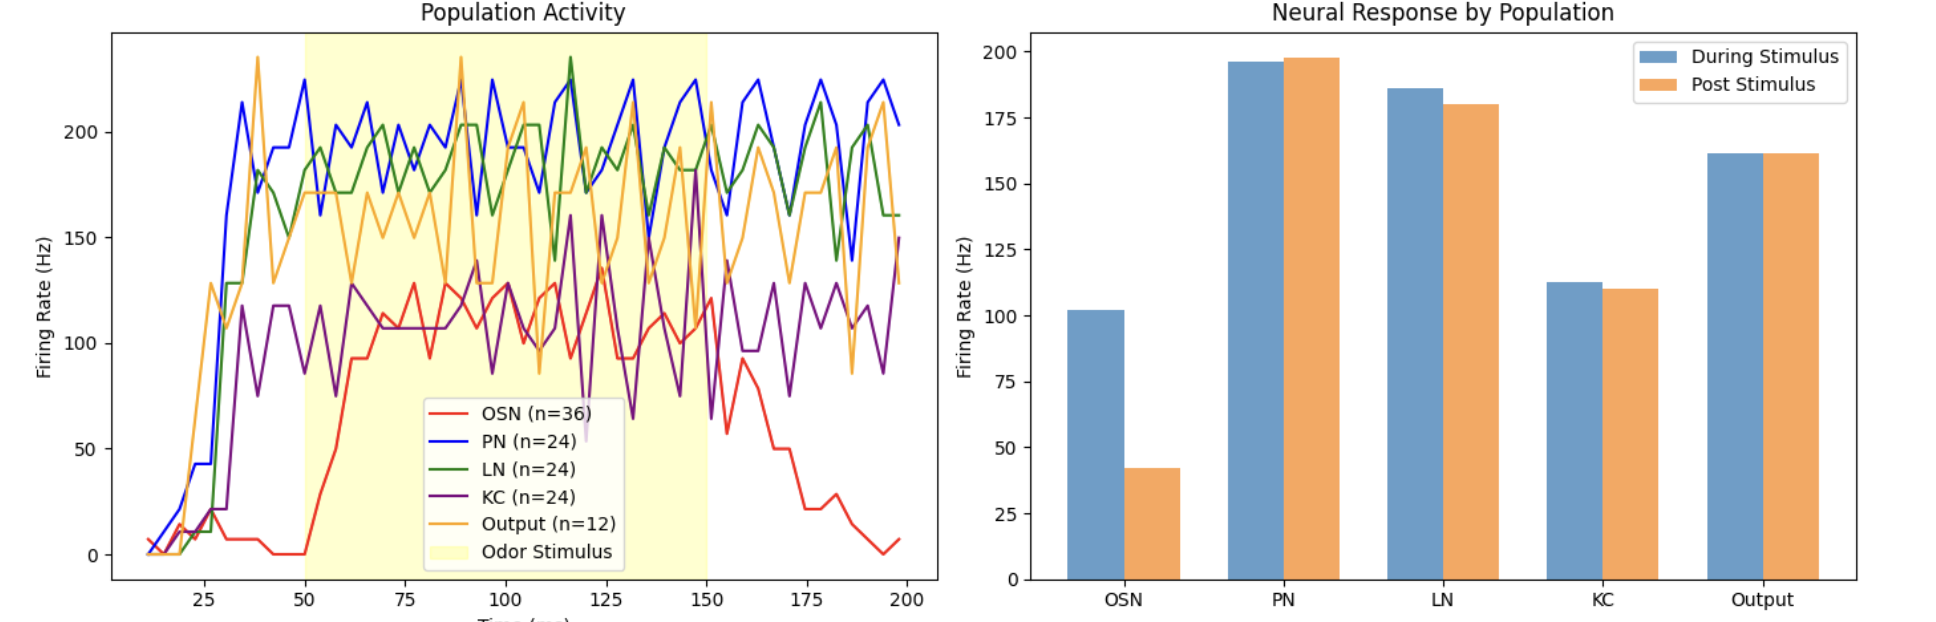
Attraction vs. aversion. The projection neurons, local interneurons, and Kenyon cells fire in nearly the same pattern for both odors. Only the output neurons differ — and that difference is the decision. Activity also persists after the stimulus ends. The same network distinguishes conflicting concepts.
Strong vs. weak. A weak and a strong version of the same odor produce the same output activity, for attraction and for aversion alike. The fly can tell which odor is present, not how strong it is.
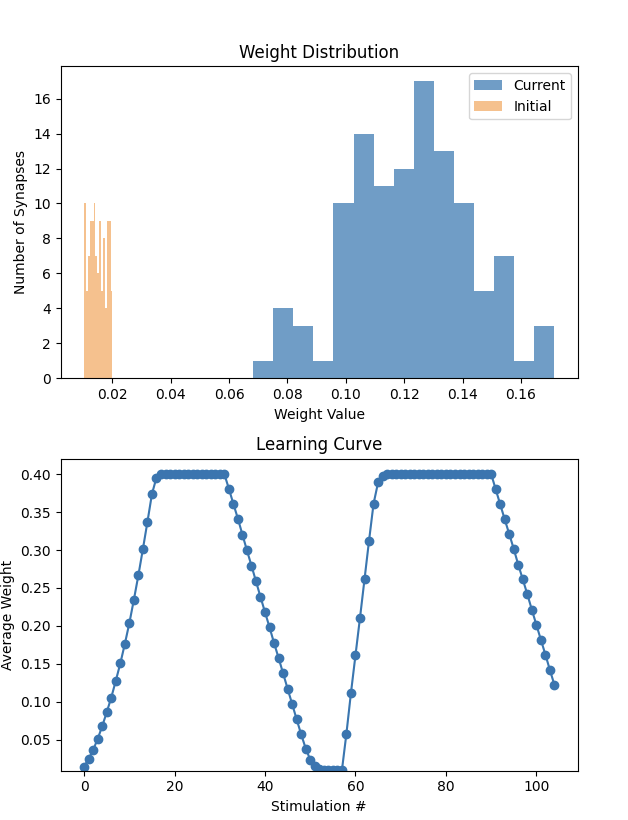
Reward and punishment. Spike-timing-dependent plasticity on its own only strengthens synapses. Add a dopamine signal — positive, then negative — and the same pathway specializes for opposite meanings: the average synaptic weight climbed to its ceiling by about trial 20, fell back to baseline by about trial 55, and climbed again by about trial 70.
What it means
- Through neuroplasticity, the same network can be transformed to learn conflicting concepts. Artificial neurons store multiple concepts too — which is what makes them hard to study — so the tools built for biological neurons may work on artificial ones.
- Smaller networks do not perceive gradations of a concept. A neuron-constrained brain learns black versus white; larger networks are needed to see the shades between.
- Biological and artificial neural networks share learning characteristics and can be studied with similar tools and methods.
What’s next
Scale the model toward the real network to see how the learning principles change with size; let the output neurons’ feedback reach every neuron on the pathway, not only the Kenyon cells; and use what works for overlapping concepts in biological networks as a guide toward understandable AI.